Go 部落格
剖析 Go 程式
在 2011 年的 Scala Days,Robert Hundt 發表一篇標題為 C++/Java/Go/Scala 中的迴圈辨識。 的論文。這篇論文採用特定迴圈尋找演算法 (例如編譯器流分析通道中所使用的) 撰寫,並使用 C++、Go、Java 和 Scala 撰寫這些程式,然後使用那些程式針對這些語言的一般效能問題提出結論。該論文中呈現的 Go 程式執行相當緩慢,此為使用 Go 的剖析工具,將一個緩慢的程式轉換為更快速的程式,並絕佳的機會。
透過使用 Go 的剖析工具找出並修正特定的瓶頸,我們可以讓 Go 的迴圈尋找程式執行速度提升一個數量級,且使用 6 倍更少的記憶體。 (更新資訊:由於最近針對 gcc 中的 libstdc++ 所進行的最佳化,記憶體降低率現為 3.7 倍。)
Hundt 的文件未指定使用 C++、Go、Java 及 Scala 工具的版本。在本篇網誌文章中,我們將使用最新 6g Go 編譯器每週快照,以及 Ubuntu Natty 發行版隨附的 g++ 版本。(我們不會使用 Java 或 Scala,因為我們不太會用這兩種語言撰寫高效率程式,所以比較起來並不公平。由於 C++ 是 paper 中最快的語言,因此這裡與 C++ 的比較應該就足夠了。)(更新:在這個更新後的文章中,我們將使用 amd64 上最新開發快照的 Go 編譯器和最新版本的 g++ - 4.8.0,已於 2013 年 3 月發佈。)
$ go version
go version devel +08d20469cc20 Tue Mar 26 08:27:18 2013 +0100 linux/amd64
$ g++ --version
g++ (GCC) 4.8.0
Copyright (C) 2013 Free Software Foundation, Inc.
...
$
這些程式在裝有 CPU 頻率調整使用已停用的 3.4GHz Core i7-2600 CPU 和 16 GB RAM 的電腦上執行,執行版本為 3.8.4-gentoo kernel 的 Gentoo Linux。電腦執行時,使用下列方式停用 CPU 頻率調整
$ sudo bash
# for i in /sys/devices/system/cpu/cpu[0-7]
do
    echo performance > $i/cpufreq/scaling_governor
done
#
我們已經將 C++ 和 Go 中 Hundt 的評量程式採取 Hundt 的評量程式,將它們組合成單一原始檔,並移除一行以上的輸出。我們將使用 Linux 的 time 用戶端程式計時,使用顯示使用者時間、系統時間、實際執行時間,以及最大記憶體用量的格式
$ cat xtime
#!/bin/sh
/usr/bin/time -f '%Uu %Ss %er %MkB %C' "$@"
$

$ make havlak1cc
g++ -O3 -o havlak1cc havlak1.cc
$ ./xtime ./havlak1cc
# of loops: 76002 (total 3800100)
loop-0, nest: 0, depth: 0
17.70u 0.05s 17.80r 715472kB ./havlak1cc
$

$ make havlak1
go build havlak1.go
$ ./xtime ./havlak1
# of loops: 76000 (including 1 artificial root node)
25.05u 0.11s 25.20r 1334032kB ./havlak1
$
C++ 程式花 17.80 秒執行,並使用 700 MB 記憶體。Go 程式花 25.20 秒執行,並使用 1302 MB 記憶體。(這些測量值很難與 paper 中的值相符,但本篇文章重點在探索如何使用 go tool pprof,而非重現 paper 中的結果。)
若要開始微調 Go 程式,我們必須先啟用剖析。如果程式碼使用 Go 測試套件 的評量基 chuẩn支援,我們可以使用 gotest 的標準 -cpuprofile 和 -memprofile 旗標。在像這裡一樣的獨立程式中,我們必須匯入 runtime/pprof,並新增數行程式碼
var cpuprofile = flag.String("cpuprofile", "", "write cpu profile to file")

func main() {
    flag.Parse()
    if *cpuprofile != "" {
        f, err := os.Create(*cpuprofile)
        if err != nil {
            log.Fatal(err)
        }
        pprof.StartCPUProfile(f)
        defer pprof.StopCPUProfile()
    }
    ...
新的程式碼定義一個名為 cpuprofile 的旗標,呼叫 Go 旗標程式庫 以分析命令列旗標,然後,如果在命令列上設定 cpuprofile 旗標,則開始 CPU 剖析,並重新導向到該檔案。剖析器需要呼叫 StopCPUProfile,才能在程式結束前清除任何待處理寫入檔案;我們使用 defer 以確保 main 回傳後會執行。
加入該程式碼後,我們可以使用新的 -cpuprofile 旗標執行程式,然後執行 go tool pprof 來詮釋剖析。
$ make havlak1.prof
./havlak1 -cpuprofile=havlak1.prof
# of loops: 76000 (including 1 artificial root node)
$ go tool pprof havlak1 havlak1.prof
Welcome to pprof!  For help, type 'help'.
(pprof)
go 工具 pprof 程式是 Google 的 pprof C++ 分析器 稍稍變換的版本。最重要的指令是 topN,它會顯示剖面中的前 N 個樣本
(pprof) top10
Total: 2525 samples
     298  11.8%  11.8%      345  13.7% runtime.mapaccess1_fast64
     268  10.6%  22.4%     2124  84.1% main.FindLoops
     251   9.9%  32.4%      451  17.9% scanblock
     178   7.0%  39.4%      351  13.9% hash_insert
     131   5.2%  44.6%      158   6.3% sweepspan
     119   4.7%  49.3%      350  13.9% main.DFS
      96   3.8%  53.1%       98   3.9% flushptrbuf
      95   3.8%  56.9%       95   3.8% runtime.aeshash64
      95   3.8%  60.6%      101   4.0% runtime.settype_flush
      88   3.5%  64.1%      988  39.1% runtime.mallocgc
當啟用 CPU 剖析時,Go 程式會每秒停止約 100 次,並記錄一個樣本,包含目前於執行的 goroutine 堆疊中的程式計數器。剖面有 2525 個樣本,因此執行時間超過 25 秒。在 go 工具 pprof 輸出中,每個在樣本中出現的函數都有一列。前兩欄顯示函數執行中的樣本數(相對於等待被呼叫函數回傳),以原始計數和樣本總數的百分比顯示。runtime.mapaccess1_fast64 函數在 298 個樣本期間執行,或 11.8%。top10 輸出依此樣本計數排序。第三欄顯示清單期間的執行總計:前三列佔樣本的 32.4%。第四和第五欄顯示函數出現的樣本數(執行或等待被呼叫函數回傳)。main.FindLoops 函數在 10.6% 的樣本中執行,但它在呼叫堆疊中(它或函數呼叫執行中)在 84.1% 的樣本中。
若要依第四和第五欄排序,請使用 -cum(用於累積)旗標
(pprof) top5 -cum
Total: 2525 samples
       0   0.0%   0.0%     2144  84.9% gosched0
       0   0.0%   0.0%     2144  84.9% main.main
       0   0.0%   0.0%     2144  84.9% runtime.main
       0   0.0%   0.0%     2124  84.1% main.FindHavlakLoops
     268  10.6%  10.6%     2124  84.1% main.FindLoops
(pprof) top5 -cum
事實上 main.FindLoops 和 main.main 的總計應為 100%,但每個堆疊樣本僅包含最底層的 100 個堆疊框架;在約四分之一的樣本中,遞迴 main.DFS 函數比 main.main 深超過 100 個框架,因此完整的追蹤會被截斷。
堆疊追蹤樣本包含關於函數呼叫關聯的更多有趣資料,比文字清單所顯示的更多。web 指令以 SVG 格式寫入剖面資料的圖表,並在網路瀏覽器中開啟。(也有 gv 指令,會寫入 PostScript 並在 Ghostview 中開啟。對於任一指令,都需要安裝 graphviz。)
(pprof) web
完整圖表的小片段看起來像
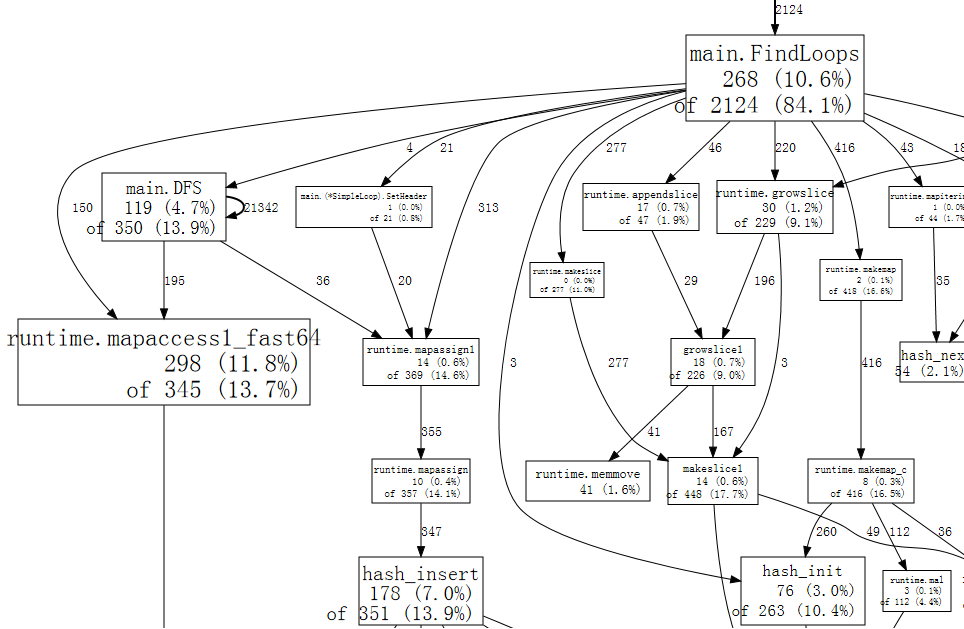
圖表中的每個方塊對應到一個函數,方塊的大小會依據函數執行期間的樣本數調整。從方塊 X 到方塊 Y 的邊緣表示 X 呼叫 Y;邊緣上的數字是這個呼叫在樣本中出現的次數。如果一個呼叫在單一樣本中出現多次,例如遞迴函數呼叫期間,每次出現都會計入邊緣權重。這說明了 main.DFS 自我邊緣上的 21342。
光是粗略一看,我們就可以看出程式花了許多時間在 hash 運算上,這對應到使用 Go 的 map 值。我們可以告訴 web 只使用包含特定功能的範例,例如 runtime.mapaccess1_fast64,這會清除圖形中的部分雜訊
(pprof) web mapaccess1
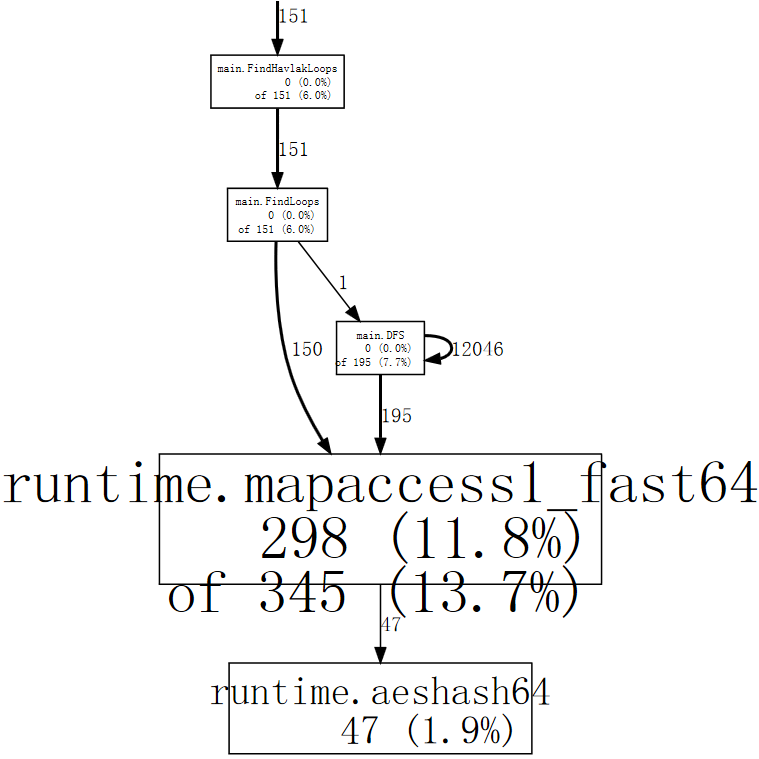
如果我們瞇起眼睛看,我們可以看到對 runtime.mapaccess1_fast64 的呼叫是由 main.FindLoops 和 main.DFS 做的。
現在我們已大致了解整體概況,是時候深入了解特定功能了。讓我們先看看 main.DFS,因為它是一個較短的功能
(pprof) list DFS
Total: 2525 samples
ROUTINE ====================== main.DFS in /home/rsc/g/benchgraffiti/havlak/havlak1.go
   119    697 Total samples (flat / cumulative)
     3      3  240: func DFS(currentNode *BasicBlock, nodes []*UnionFindNode, number map[*BasicBlock]int, last []int, current int) int {
     1      1  241:     nodes[current].Init(currentNode, current)
     1     37  242:     number[currentNode] = current
     .      .  243:
     1      1  244:     lastid := current
    89     89  245:     for _, target := range currentNode.OutEdges {
     9    152  246:             if number[target] == unvisited {
     7    354  247:                     lastid = DFS(target, nodes, number, last, lastid+1)
     .      .  248:             }
     .      .  249:     }
     7     59  250:     last[number[currentNode]] = lastid
     1      1  251:     return lastid
(pprof)
清單顯示了 DFS 功能的原始碼(實際上是符合正規表示式 DFS 的每個功能)。前三欄是執行該行時採集的範例數量、執行該行或在該行呼叫的程式碼中採集的範例數量,以及檔案中的行號。相關指令 disasm 會顯示功能的解組碼,而不是原始碼清單;當有足夠的範例時,這可以幫助你看出哪些指令較耗費效能。指令 weblist 會混合兩種模式:它會顯示 一個原始碼清單,在其中按一下某一行就會顯示解組碼。
由於我們已經知道時間花費在 hash 執行時間函式實作的地圖查詢上,因此我們最重視的是第二欄。正如遞迴巡覽所預期的那樣,相當多的時間花費在對 DFS 的遞迴呼叫上(第 247 行)。排除遞迴,看來時間花費在第 242、246 和 250 行的地圖 number 的存取上。對於特定的查詢,地圖並非最有效率的選擇。就像在編譯器中一樣,基本區塊結構會指定唯一的序列號碼給它們。我們可以使用 []int(由區塊號碼索引的區段)取代使用 map[*BasicBlock]int。當陣列或區段可以執行這項工作時,就沒有理由使用地圖。
將 number 從地圖變更為區段需要編輯程式中的七行,並將其執行時間縮短了將近一倍
$ make havlak2
go build havlak2.go
$ ./xtime ./havlak2
# of loops: 76000 (including 1 artificial root node)
16.55u 0.11s 16.69r 1321008kB ./havlak2
$
(請參閱 havlak1 和 havlak2 之間的差異)
我們可以再次執行分析器,以確認 main.DFS 不再是執行時間的重要部分
$ make havlak2.prof
./havlak2 -cpuprofile=havlak2.prof
# of loops: 76000 (including 1 artificial root node)
$ go tool pprof havlak2 havlak2.prof
Welcome to pprof!  For help, type 'help'.
(pprof)
(pprof) top5
Total: 1652 samples
     197  11.9%  11.9%      382  23.1% scanblock
     189  11.4%  23.4%     1549  93.8% main.FindLoops
     130   7.9%  31.2%      152   9.2% sweepspan
     104   6.3%  37.5%      896  54.2% runtime.mallocgc
      98   5.9%  43.5%      100   6.1% flushptrbuf
(pprof)
main.DFS 輸入埠不再出現在設定檔中,而其他程式執行時間也減少了。現在,程式大部份時間都花在配置記憶體和垃圾回收方面(runtime.mallocgc 會配置並執行定期垃圾回收,使用率為 54.2%)。要找出垃圾回收器為何會執行那麼多次,我們必須找出在配置記憶體的原因。一種方法是將程式加入記憶體分析功能。我們會安排在提供 -memprofile 旗標的情況下,程式在找到迴圈後停止,並寫入記憶體設定檔並結束。
var memprofile = flag.String("memprofile", "", "write memory profile to this file")
...

    FindHavlakLoops(cfgraph, lsgraph)
    if *memprofile != "" {
        f, err := os.Create(*memprofile)
        if err != nil {
            log.Fatal(err)
        }
        pprof.WriteHeapProfile(f)
        f.Close()
        return
    }
我們使用 -memprofile 旗標執行程式來撰寫設定檔。
$ make havlak3.mprof
go build havlak3.go
./havlak3 -memprofile=havlak3.mprof
$
(請參閱 havlak2 的相異點)
我們完全以相同的方式使用 go tool pprof。現在我們檢查的是記憶體配置,而不是時脈週期。
$ go tool pprof havlak3 havlak3.mprof
Adjusting heap profiles for 1-in-524288 sampling rate
Welcome to pprof!  For help, type 'help'.
(pprof) top5
Total: 82.4 MB
    56.3  68.4%  68.4%     56.3  68.4% main.FindLoops
    17.6  21.3%  89.7%     17.6  21.3% main.(*CFG).CreateNode
     8.0   9.7%  99.4%     25.6  31.0% main.NewBasicBlockEdge
     0.5   0.6% 100.0%      0.5   0.6% itab
     0.0   0.0% 100.0%      0.5   0.6% fmt.init
(pprof)
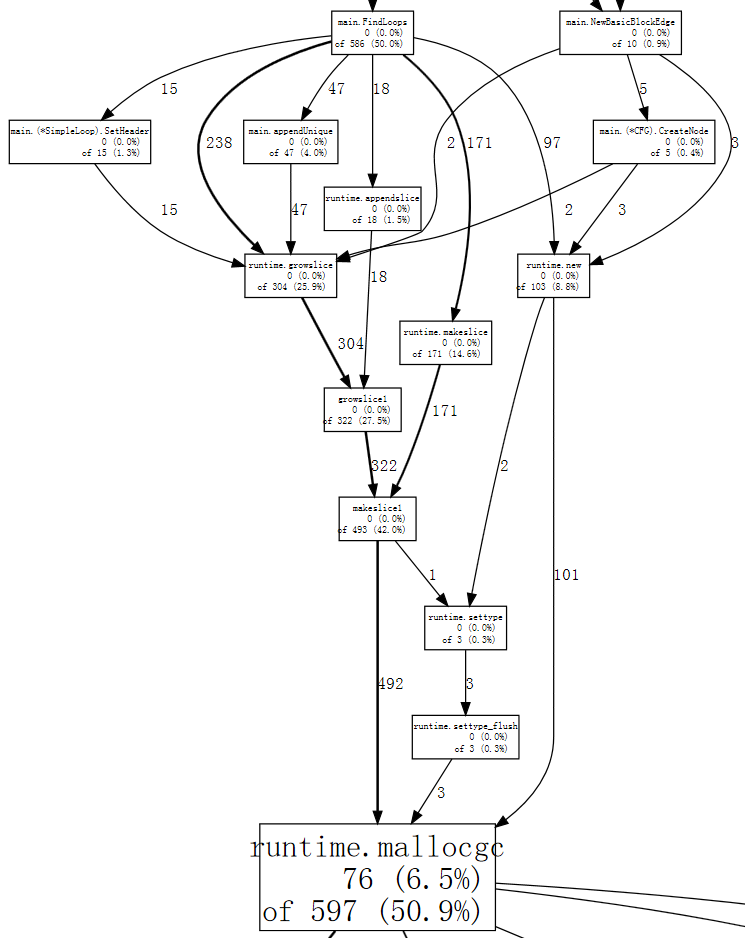
go tool pprof 指令報告 FindLoops 已配置約 82.4 MB 容量中的 56.3 個近似值;CreateNode 則配置了 17.6 MB 的容量。為了降低負擔,記憶體分析功能每配置半兆位元組僅記錄一區塊的資訊(以「1/524288 取樣頻率」計),所以這些都是實際計數的近似值。
為了找出記憶體配置,我們可以列出那些函式。
(pprof) list FindLoops
Total: 82.4 MB
ROUTINE ====================== main.FindLoops in /home/rsc/g/benchgraffiti/havlak/havlak3.go
  56.3   56.3 Total MB (flat / cumulative)
...
   1.9    1.9  268:     nonBackPreds := make([]map[int]bool, size)
   5.8    5.8  269:     backPreds := make([][]int, size)
     .      .  270:
   1.9    1.9  271:     number := make([]int, size)
   1.9    1.9  272:     header := make([]int, size, size)
   1.9    1.9  273:     types := make([]int, size, size)
   1.9    1.9  274:     last := make([]int, size, size)
   1.9    1.9  275:     nodes := make([]*UnionFindNode, size, size)
     .      .  276:
     .      .  277:     for i := 0; i < size; i++ {
   9.5    9.5  278:             nodes[i] = new(UnionFindNode)
     .      .  279:     }
...
     .      .  286:     for i, bb := range cfgraph.Blocks {
     .      .  287:             number[bb.Name] = unvisited
  29.5   29.5  288:             nonBackPreds[i] = make(map[int]bool)
     .      .  289:     }
...
目前的瓶頸似乎與上一個瓶頸相同:在較簡單的資料結構就夠用的地方使用字典。FindLoops 配置了約 29.5 MB 的字典。
順帶一提,如果我們使用 --inuse_objects 旗標執行 go tool pprof,它將會報告配置計數,而不是配置大小。
$ go tool pprof --inuse_objects havlak3 havlak3.mprof
Adjusting heap profiles for 1-in-524288 sampling rate
Welcome to pprof!  For help, type 'help'.
(pprof) list FindLoops
Total: 1763108 objects
ROUTINE ====================== main.FindLoops in /home/rsc/g/benchgraffiti/havlak/havlak3.go
720903 720903 Total objects (flat / cumulative)
...
     .      .  277:     for i := 0; i < size; i++ {
311296 311296  278:             nodes[i] = new(UnionFindNode)
     .      .  279:     }
     .      .  280:
     .      .  281:     // Step a:
     .      .  282:     //   - initialize all nodes as unvisited.
     .      .  283:     //   - depth-first traversal and numbering.
     .      .  284:     //   - unreached BB's are marked as dead.
     .      .  285:     //
     .      .  286:     for i, bb := range cfgraph.Blocks {
     .      .  287:             number[bb.Name] = unvisited
409600 409600  288:             nonBackPreds[i] = make(map[int]bool)
     .      .  289:     }
...
(pprof)
由於這約 200,000 個字典配置了 29.5 MB 的容量,初期字典配置似乎使用了約 150 個位元組。如果使用字典來儲存鍵值對時,這是很合理的,但如果使用字典來取代這裡的簡單集合,則是不適當的。
我們可以使用一個簡單的區塊來列出元素,而不是使用字典。在字典被使用的案例中,其中一個案例是演算法不可能插入重複元素。在剩餘的案例中,我們可以撰寫一個簡單的內建 append 函式變體。
func appendUnique(a []int, x int) []int {
    for _, y := range a {
        if x == y {
            return a
        }
    }
    return append(a, x)
}
除了撰寫那個函式之外,將 Go 程式變更為使用區塊(而非字典)只需要變更幾行程式碼。
$ make havlak4
go build havlak4.go
$ ./xtime ./havlak4
# of loops: 76000 (including 1 artificial root node)
11.84u 0.08s 11.94r 810416kB ./havlak4
$
(請參閱 havlak3 相異點)
我們現在比開始時快了 2.11 倍。讓我們再看一下 CPU 設定檔。
$ make havlak4.prof
./havlak4 -cpuprofile=havlak4.prof
# of loops: 76000 (including 1 artificial root node)
$ go tool pprof havlak4 havlak4.prof
Welcome to pprof!  For help, type 'help'.
(pprof) top10
Total: 1173 samples
     205  17.5%  17.5%     1083  92.3% main.FindLoops
     138  11.8%  29.2%      215  18.3% scanblock
      88   7.5%  36.7%       96   8.2% sweepspan
      76   6.5%  43.2%      597  50.9% runtime.mallocgc
      75   6.4%  49.6%       78   6.6% runtime.settype_flush
      74   6.3%  55.9%       75   6.4% flushptrbuf
      64   5.5%  61.4%       64   5.5% runtime.memmove
      63   5.4%  66.8%      524  44.7% runtime.growslice
      51   4.3%  71.1%       51   4.3% main.DFS
      50   4.3%  75.4%      146  12.4% runtime.MCache_Alloc
(pprof)
現在,記憶體配置與後續的垃圾回收(runtime.mallocgc)佔用了我們的執行時間 50.9%。另一種檢視系統為何會進行垃圾回收的方法是查看會導致持續回收的配置,亦即在 mallocgc 中花費最多時間的配置。
(pprof) web mallocgc
要辨識此圖表有什麼狀況很困難,因為有許多節點的範例數量都很少,掩蓋了較大的節點。我們可以告訴 go tool pprof 忽略佔樣本數量不到 10% 的節點
$ go tool pprof --nodefraction=0.1 havlak4 havlak4.prof
Welcome to pprof!  For help, type 'help'.
(pprof) web mallocgc
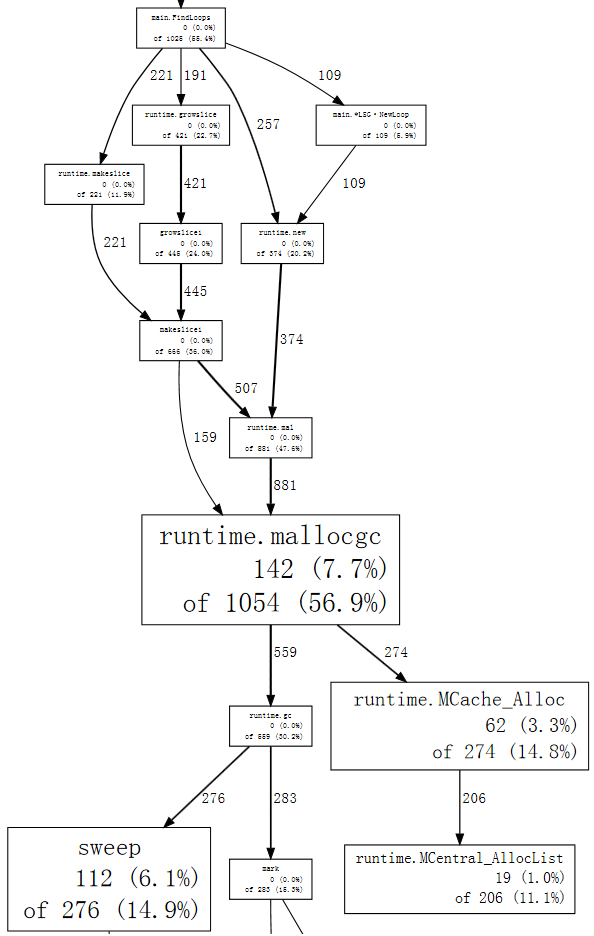
現在,我們可以輕鬆地追蹤粗箭頭,看出 FindLoops 會觸發大部分的垃圾蒐集。如果我們列出 FindLoops,就能看出大部分情況出現在一開始
(pprof) list FindLoops
...
     .      .  270: func FindLoops(cfgraph *CFG, lsgraph *LSG) {
     .      .  271:     if cfgraph.Start == nil {
     .      .  272:             return
     .      .  273:     }
     .      .  274:
     .      .  275:     size := cfgraph.NumNodes()
     .      .  276:
     .    145  277:     nonBackPreds := make([][]int, size)
     .      9  278:     backPreds := make([][]int, size)
     .      .  279:
     .      1  280:     number := make([]int, size)
     .     17  281:     header := make([]int, size, size)
     .      .  282:     types := make([]int, size, size)
     .      .  283:     last := make([]int, size, size)
     .      .  284:     nodes := make([]*UnionFindNode, size, size)
     .      .  285:
     .      .  286:     for i := 0; i < size; i++ {
     2     79  287:             nodes[i] = new(UnionFindNode)
     .      .  288:     }
...
(pprof)
每次呼叫 FindLoops,就會配置一些相當大的簿記結構。由於基準測試會呼叫 FindLoops 50 次,這些結構會累積成大量的垃圾,導致垃圾收集器執行大量的作業。
儘管使用垃圾蒐集語言,不代表你可以忽視記憶體配置問題。在此情況中,一種簡單的解決方案是建立快取,讓每次呼叫 FindLoops 時,就能依可能性重複使用前一次呼叫的儲存體。(實際上,Hundt 在論文中說明 Java 程式只要進行這項變更,就能獲得近乎合理的效能,但他在其他垃圾蒐集實作中並未進行相同的變更。)
我們會新增一個全域的 cache 結構
var cache struct {
    size int
    nonBackPreds [][]int
    backPreds [][]int
    number []int
    header []int
    types []int
    last []int
    nodes []*UnionFindNode
}
然後讓 FindLoops 參照此快取,以取代配置
if cache.size < size {
    cache.size = size
    cache.nonBackPreds = make([][]int, size)
    cache.backPreds = make([][]int, size)
    cache.number = make([]int, size)
    cache.header = make([]int, size)
    cache.types = make([]int, size)
    cache.last = make([]int, size)
    cache.nodes = make([]*UnionFindNode, size)
    for i := range cache.nodes {
        cache.nodes[i] = new(UnionFindNode)
    }
}

nonBackPreds := cache.nonBackPreds[:size]
for i := range nonBackPreds {
    nonBackPreds[i] = nonBackPreds[i][:0]
}
backPreds := cache.backPreds[:size]
for i := range nonBackPreds {
    backPreds[i] = backPreds[i][:0]
}
number := cache.number[:size]
header := cache.header[:size]
types := cache.types[:size]
last := cache.last[:size]
nodes := cache.nodes[:size]
當然,這種全域變數的工程實務不佳:這表示並行呼叫 FindLoops 現在並不安全。目前,我們會進行最小的變更,以便了解對程式效能而言什麼才是重要的;此變更很簡單,且與 Java 實作中的程式碼類似。此 Go 程式的最終版本會使用不同的 LoopFinder 來追蹤此記憶體,並恢復並行使用的可能性。
$ make havlak5
go build havlak5.go
$ ./xtime ./havlak5
# of loops: 76000 (including 1 artificial root node)
8.03u 0.06s 8.11r 770352kB ./havlak5
$
(請參閱 havlak4 的比較)
我們可以進一步清理程式並提升其速度,但不需要我們尚未展示的分析技術。內圈迴圈中使用的作業清單可以在多次反覆運算和 FindLoops 的呼叫間重複使用,且可以與該通行中產生的個別「節點池」結合。類似地,可以在每個反覆運算中重複使用該迴圈圖形儲存體,而不用重新配置。除了這些效能變更外,最終版本 是使用具有慣用語法的 Go 樣式、使用資料結構和方法寫成的。語法變更對執行時間僅產生微小的影響:演算法和約束條件並未變更。
最終版本在 2.29 秒內執行,並使用 351 MB 記憶體
$ make havlak6
go build havlak6.go
$ ./xtime ./havlak6
# of loops: 76000 (including 1 artificial root node)
2.26u 0.02s 2.29r 360224kB ./havlak6
$
相較於我們最初的程式,快了 11 倍。即使我們停用已產生迴圈圖形的重複使用,讓只有已快取的記憶體是迴圈尋找簿記,程式執行速度仍然比原來的快 6.7 倍,且使用的記憶體較少 1.5 倍。
$ ./xtime ./havlak6 -reuseloopgraph=false
# of loops: 76000 (including 1 artificial root node)
3.69u 0.06s 3.76r 797120kB ./havlak6 -reuseloopgraph=false
$
當然,現在將這個 Go 程式與原始的 C++ 程式進行比較並非公平,後者使用了低效的資料結構,像是 set,而 vector 會更適合。為了進行完整性檢查,我們已將最終的 Go 程式翻譯成 等效的 C++ 程式碼。其執行時間與 Go 程式相似
$ make havlak6cc
g++ -O3 -o havlak6cc havlak6.cc
$ ./xtime ./havlak6cc
# of loops: 76000 (including 1 artificial root node)
1.99u 0.19s 2.19r 387936kB ./havlak6cc
Go 程式運作得幾乎與 C++ 程式一樣快。由於 C++ 程式使用自動刪除和分配,而非明確快取,因此 C++ 程式較短且容易撰寫,但並非如此顯著
$ wc havlak6.cc; wc havlak6.go
 401 1220 9040 havlak6.cc
 461 1441 9467 havlak6.go
$
(請參閱 havlak6.cc 和 havlak6.go)
基準測試僅與其所測量的程式一樣好。我們使用 go tool pprof 來檢視低效的 Go 程式,然後將其效能提升一個數量級,並將其記憶體用量減少 3.7 倍。隨後與等效最佳化的 C++ 程式進行比較後顯示,當程式設計人員小心處理內部迴圈產生的垃圾量時,Go 可以與 C++ 相抗衡。
程式來源、Linux x86-64 二進位檔和用來撰寫此文章的剖析記錄可於 GitHub 上的 benchgraffiti 專案 使用。
如上所述,go test 已包含下列剖析記錄旗標:定義一個 基準測試函式,即可完成所有設定。此外,也有剖析資料的標準 HTTP 介面。在 HTTP 伺服器中,新增
import _ "net/http/pprof"
將為 /debug/pprof/ 下的幾個 URL 安裝處理常式。然後,你可以執行 go tool pprof,搭配一個參數,也就是到你伺服器剖析資料的 URL,如此一來,便會下載並檢視即時剖析記錄。
go tool pprof http://localhost:6060/debug/pprof/profile   # 30-second CPU profile
go tool pprof http://localhost:6060/debug/pprof/heap      # heap profile
go tool pprof http://localhost:6060/debug/pprof/block     # goroutine blocking profile
會在未來的文章中說明 goroutine 攔截剖析記錄。敬請期待。
下一篇文章:Go 中的一等函式
上一篇文章:外接 Go 函式庫聚焦
網誌索引